
Product
See the whole system, screen by screen
Aafiyet is working software, not a concept. Every screen below is the real interface, captured from a running instance. Follow one patient from a morning phone call all the way through to a report a payer would accept.
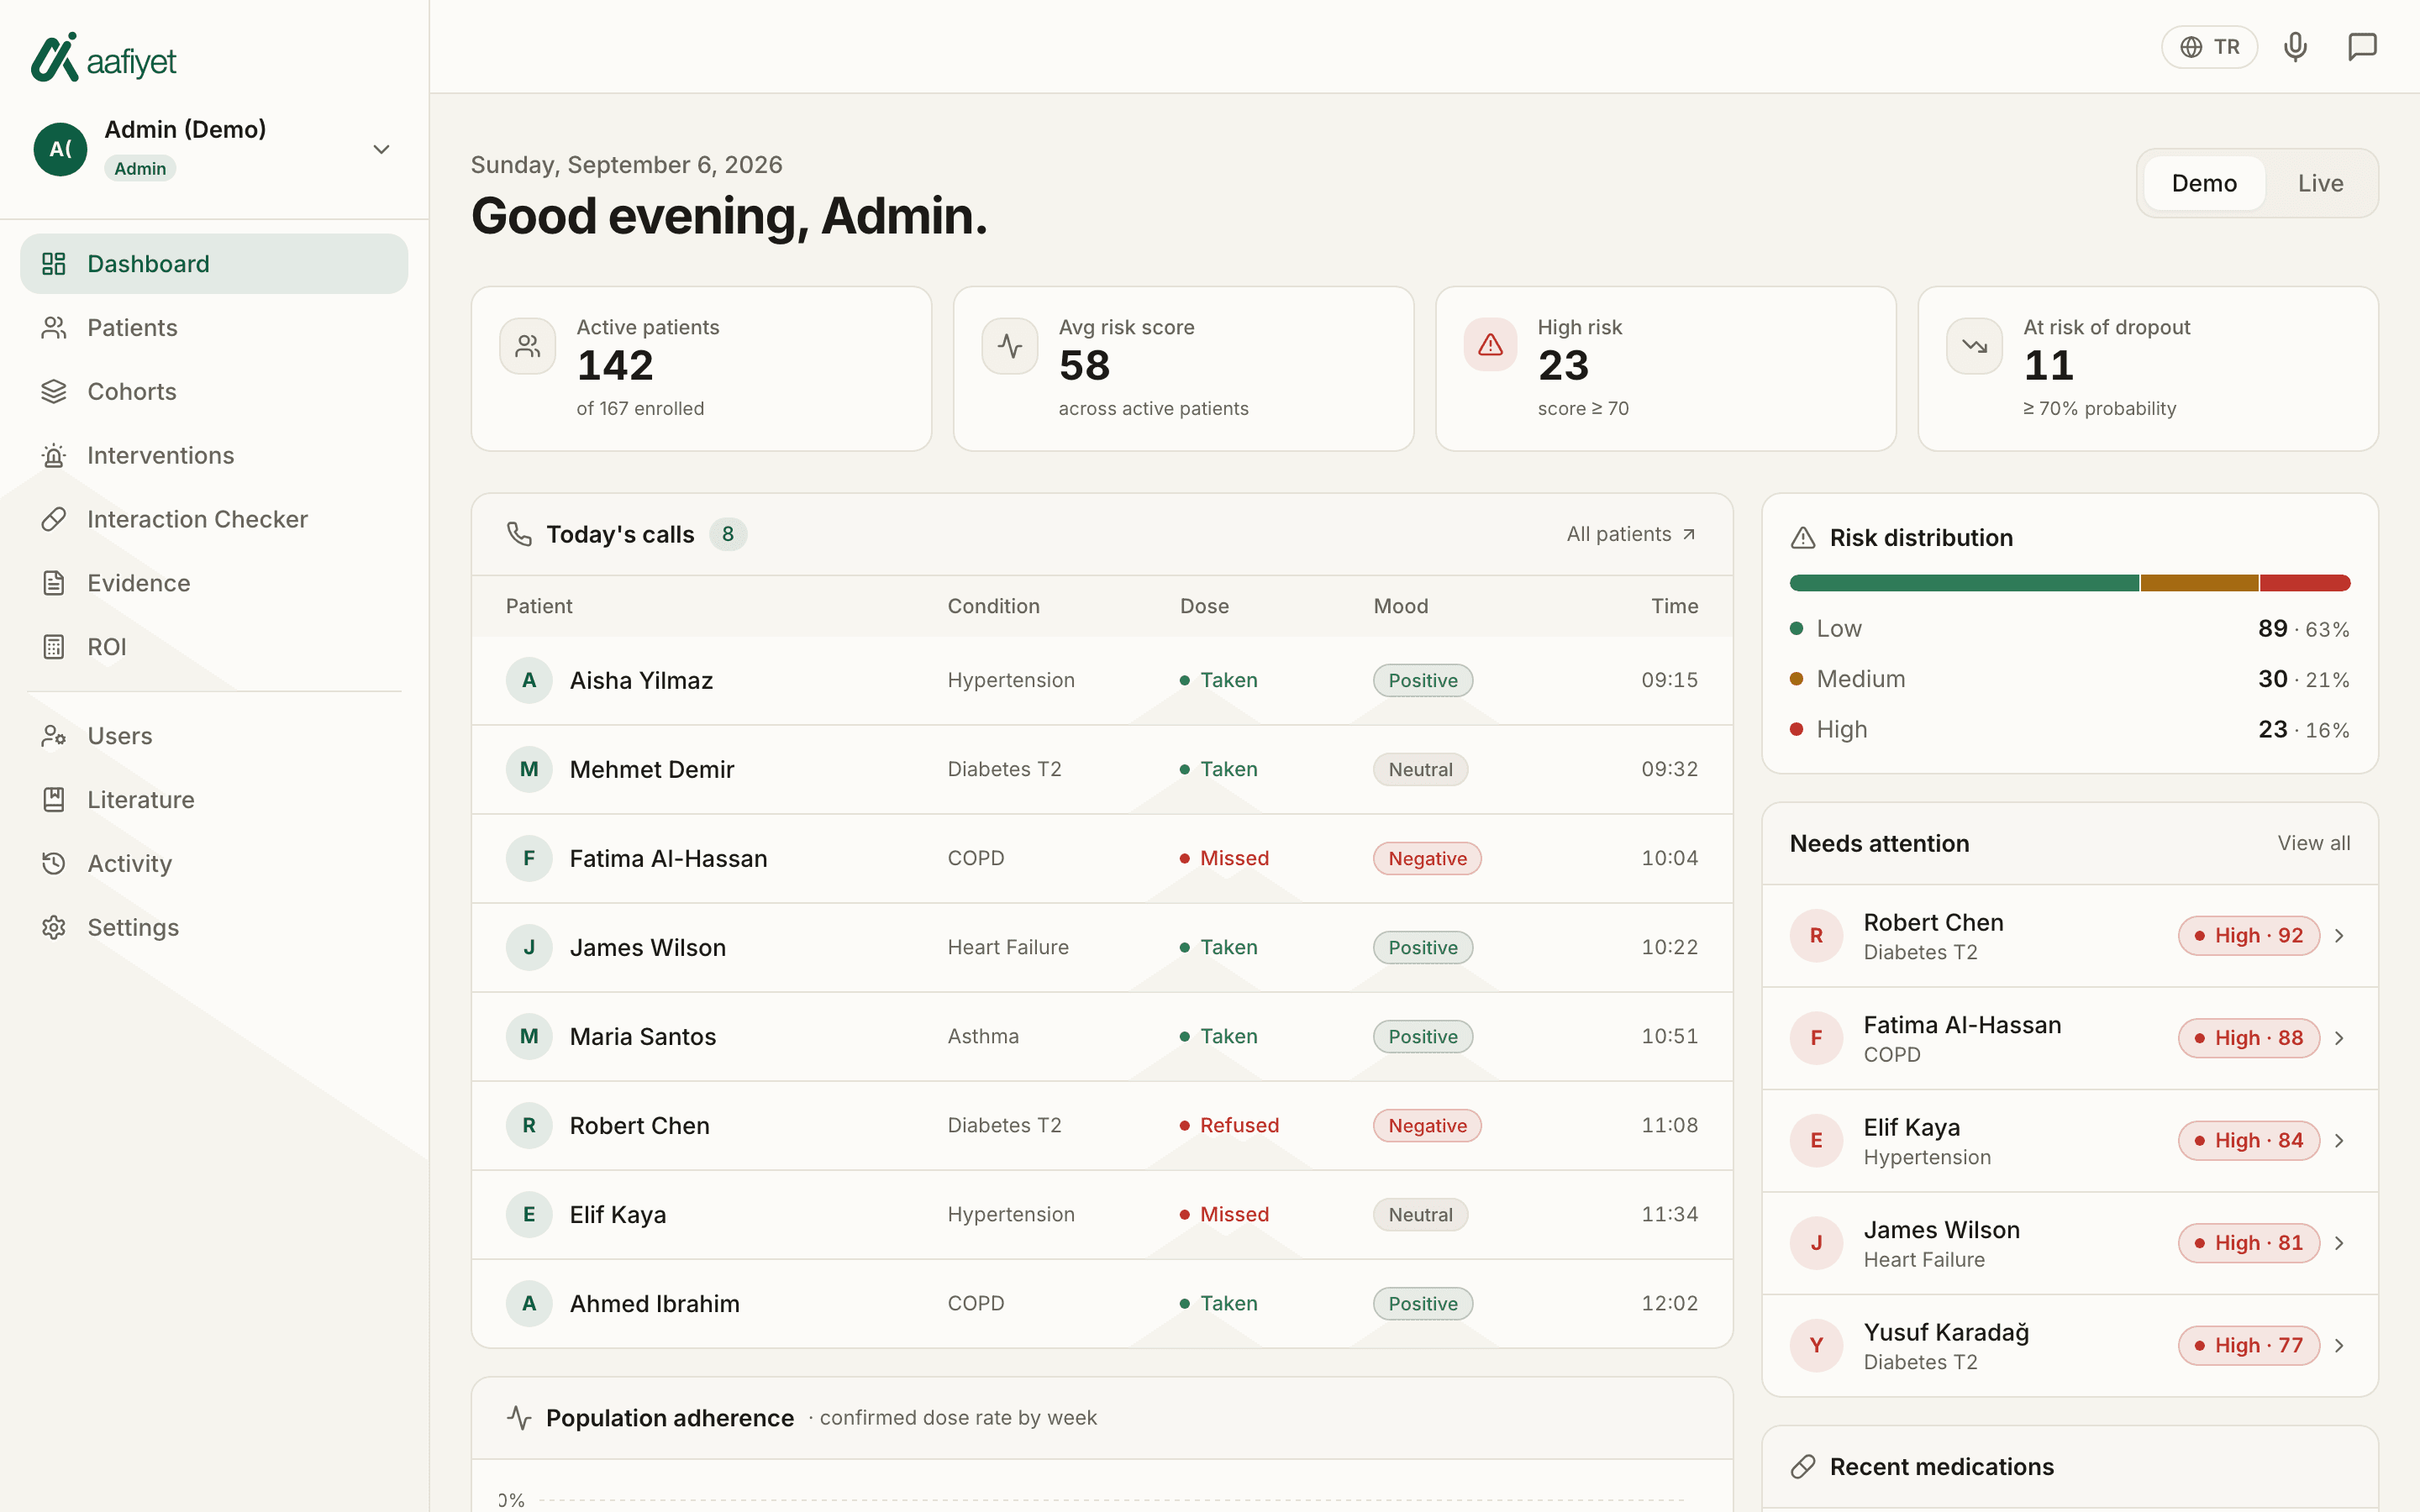
Synthetic demonstration data — no real patient information.
Daily calls
Every patient gets a call. Every call becomes data.
Aafiyet phones each enrolled patient on their own schedule and has a short, natural conversation in Turkish or English. Dose confirmation, side effects and tone are captured automatically — no app for the patient to open, nothing for staff to type up.
- Confirms the dose, asks about side effects, notes how they sound
- Runs on each patient's own call window and language
- Missed and refused doses are flagged the moment they happen
Synthetic demonstration data — no real patient information.
Explainable risk
A risk score you can argue with
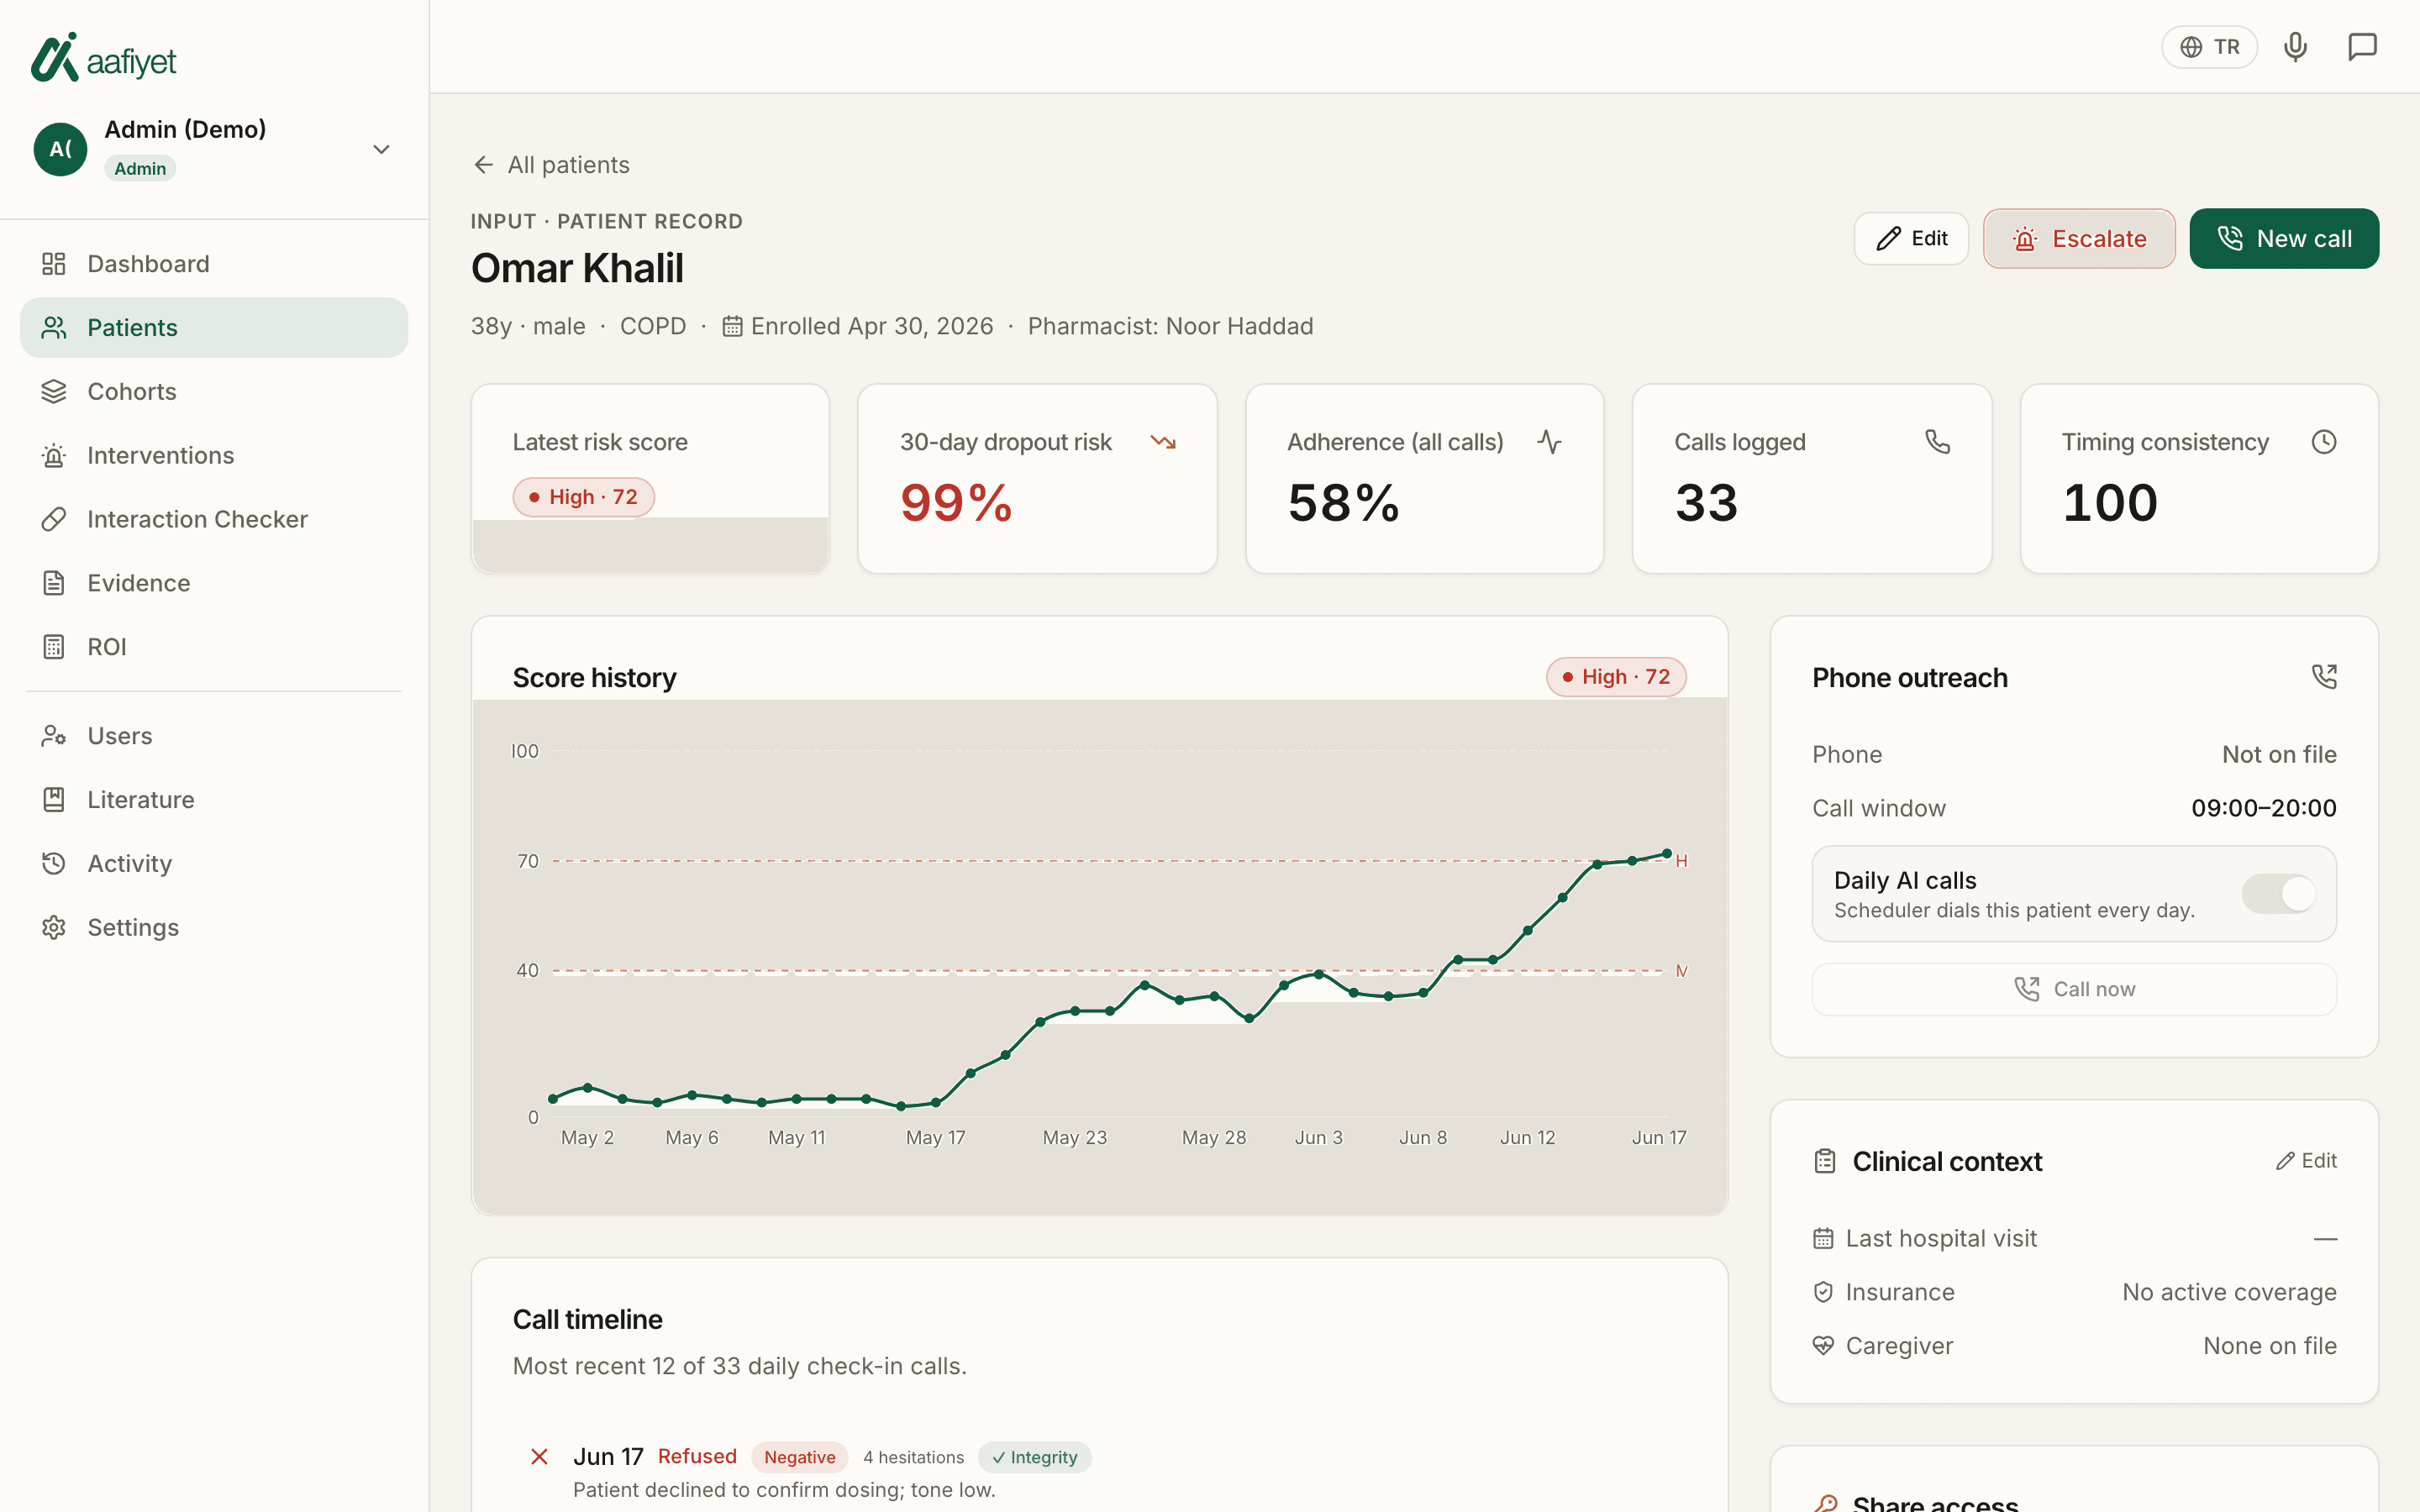
Each call is scored by a transparent, rule-based model — never a black box. The patient record shows the score's whole history and exactly which signals moved it, so a pharmacist can agree or disagree on clinical grounds.
- 0–100 score plus a 30-day dropout probability
- "Why this score" breaks the number into its contributing signals
- Full call timeline with dose, sentiment and reported side effects
Synthetic demonstration data — no real patient information.
Triage
The patients who need you, at the top
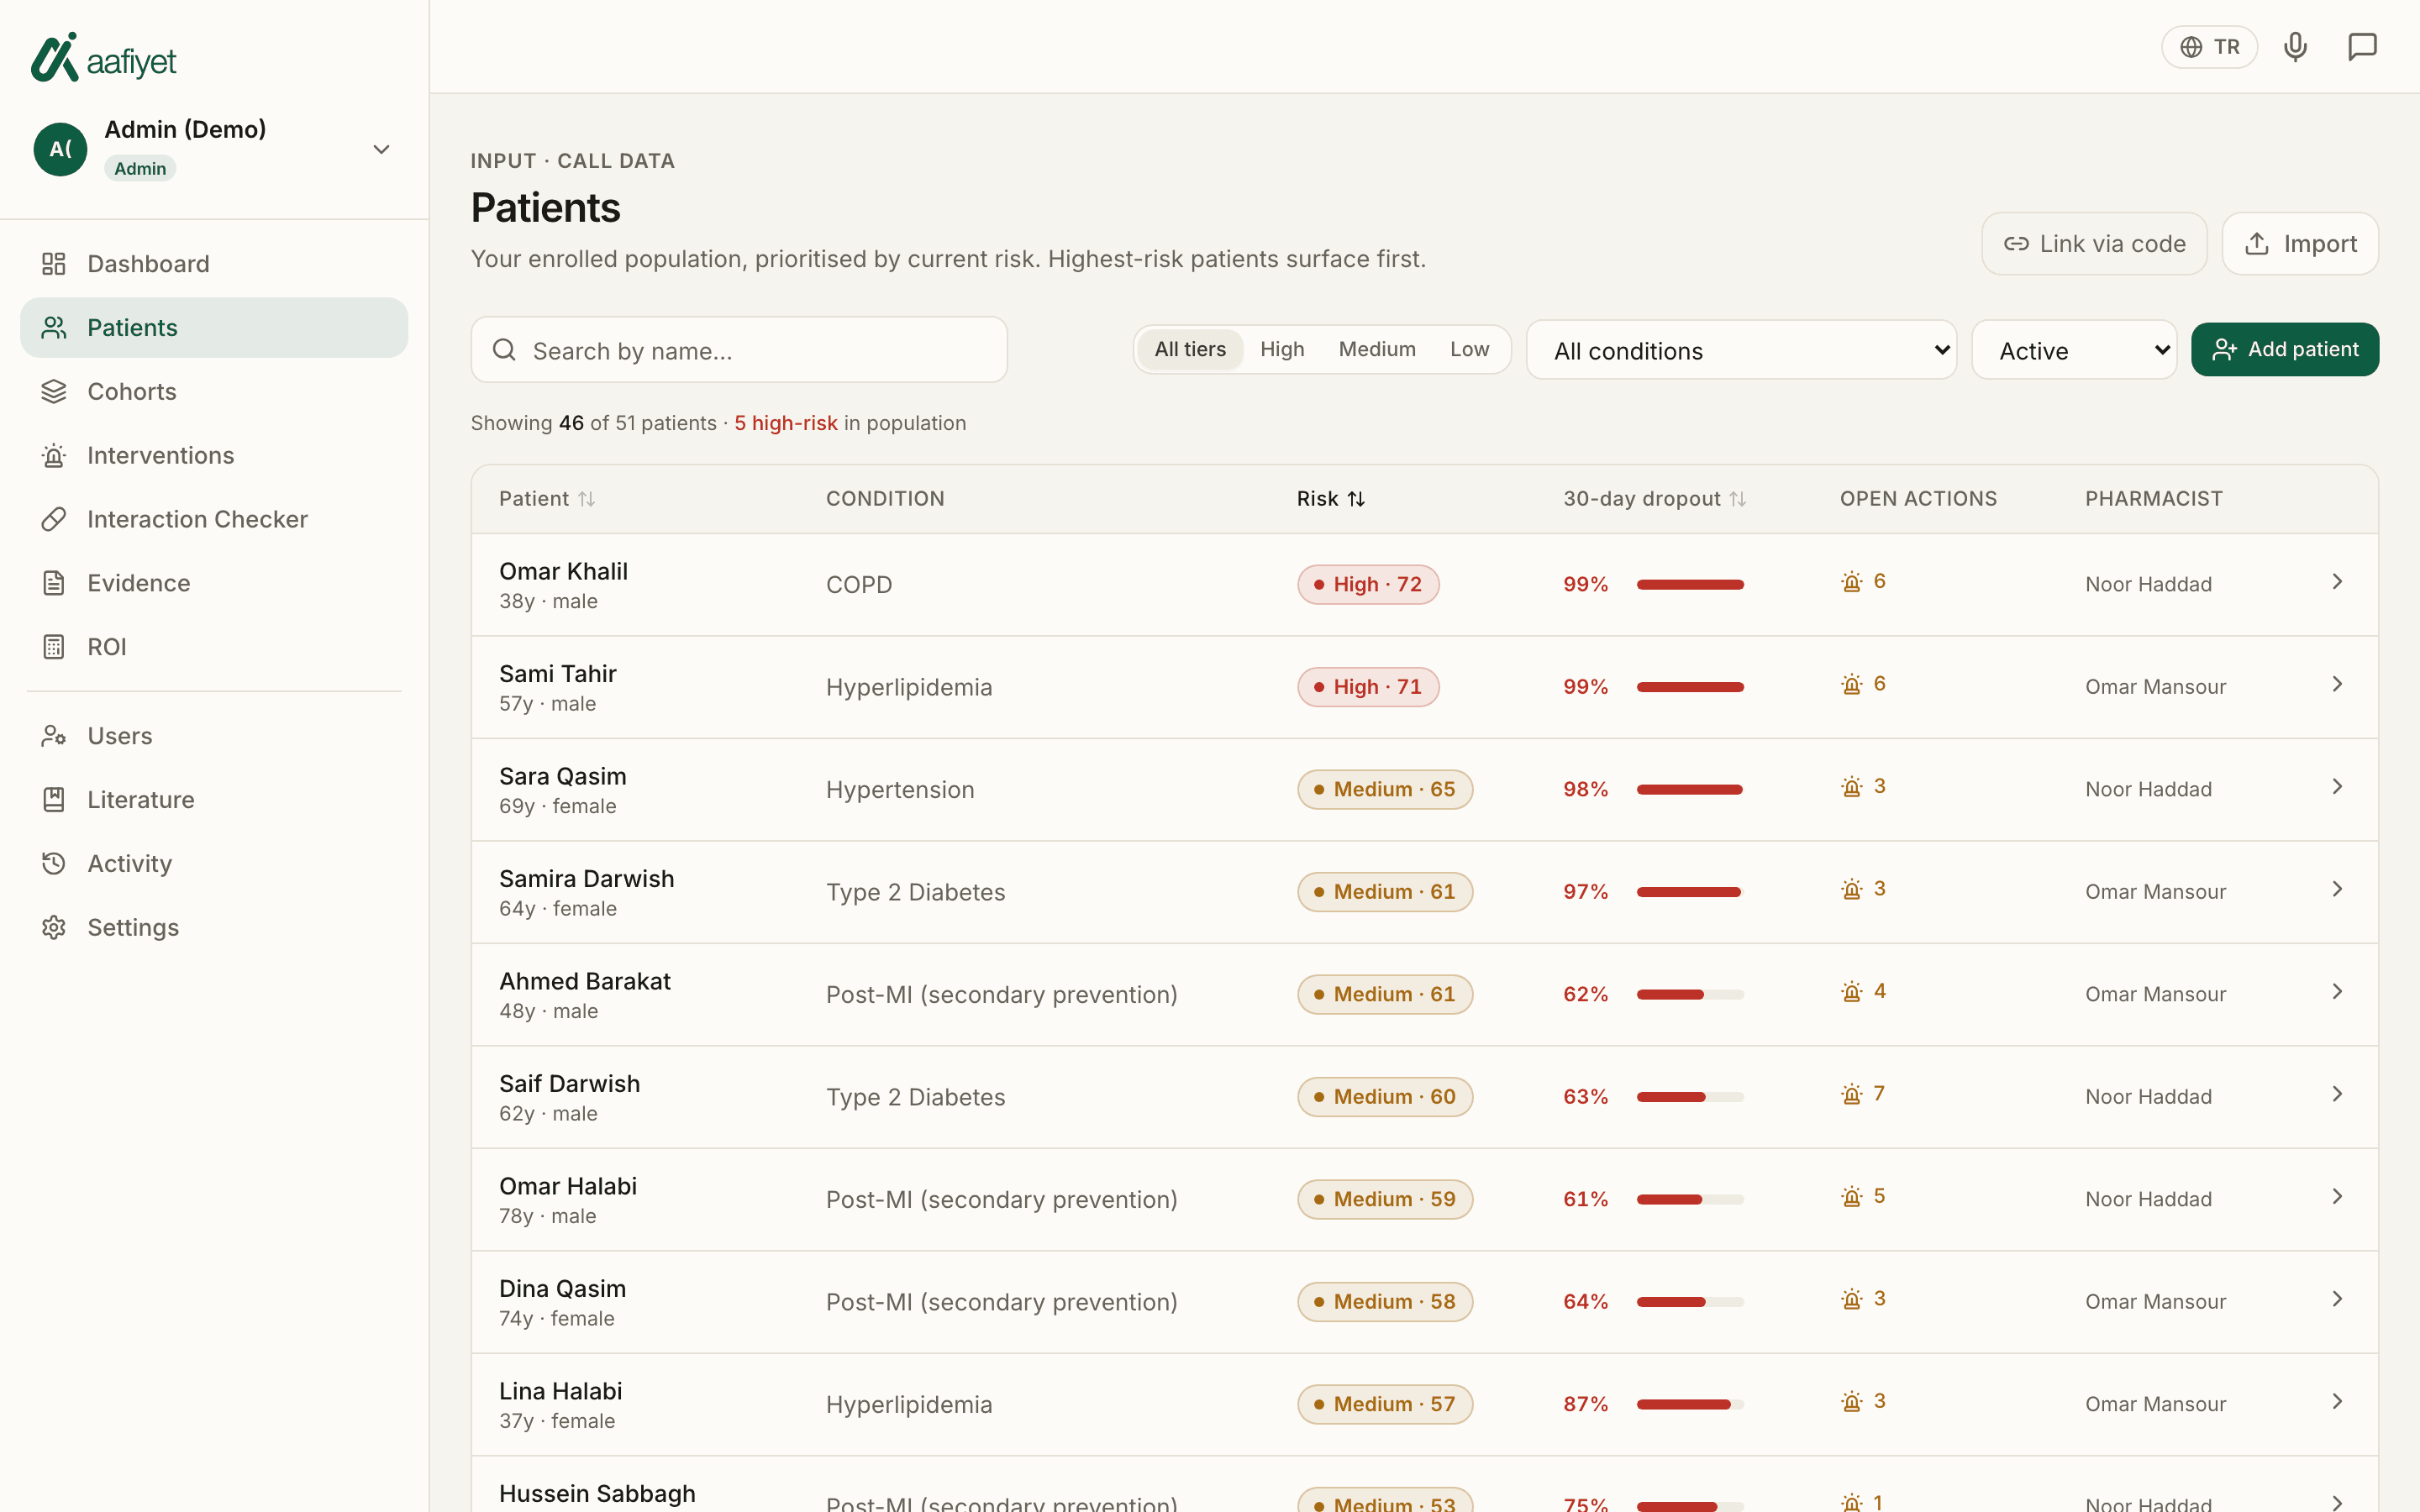
Instead of a flat roster, the list is ordered by current risk and refreshed after every call. A pharmacist opens it in the morning and immediately knows where the day should go.
- Sorted by risk, filterable by condition, tier, age and adherence timing
- Open actions and assigned pharmacist visible per row
- Import your existing patient list by spreadsheet
Synthetic demonstration data — no real patient information.
Action
Escalations, queued and prioritised
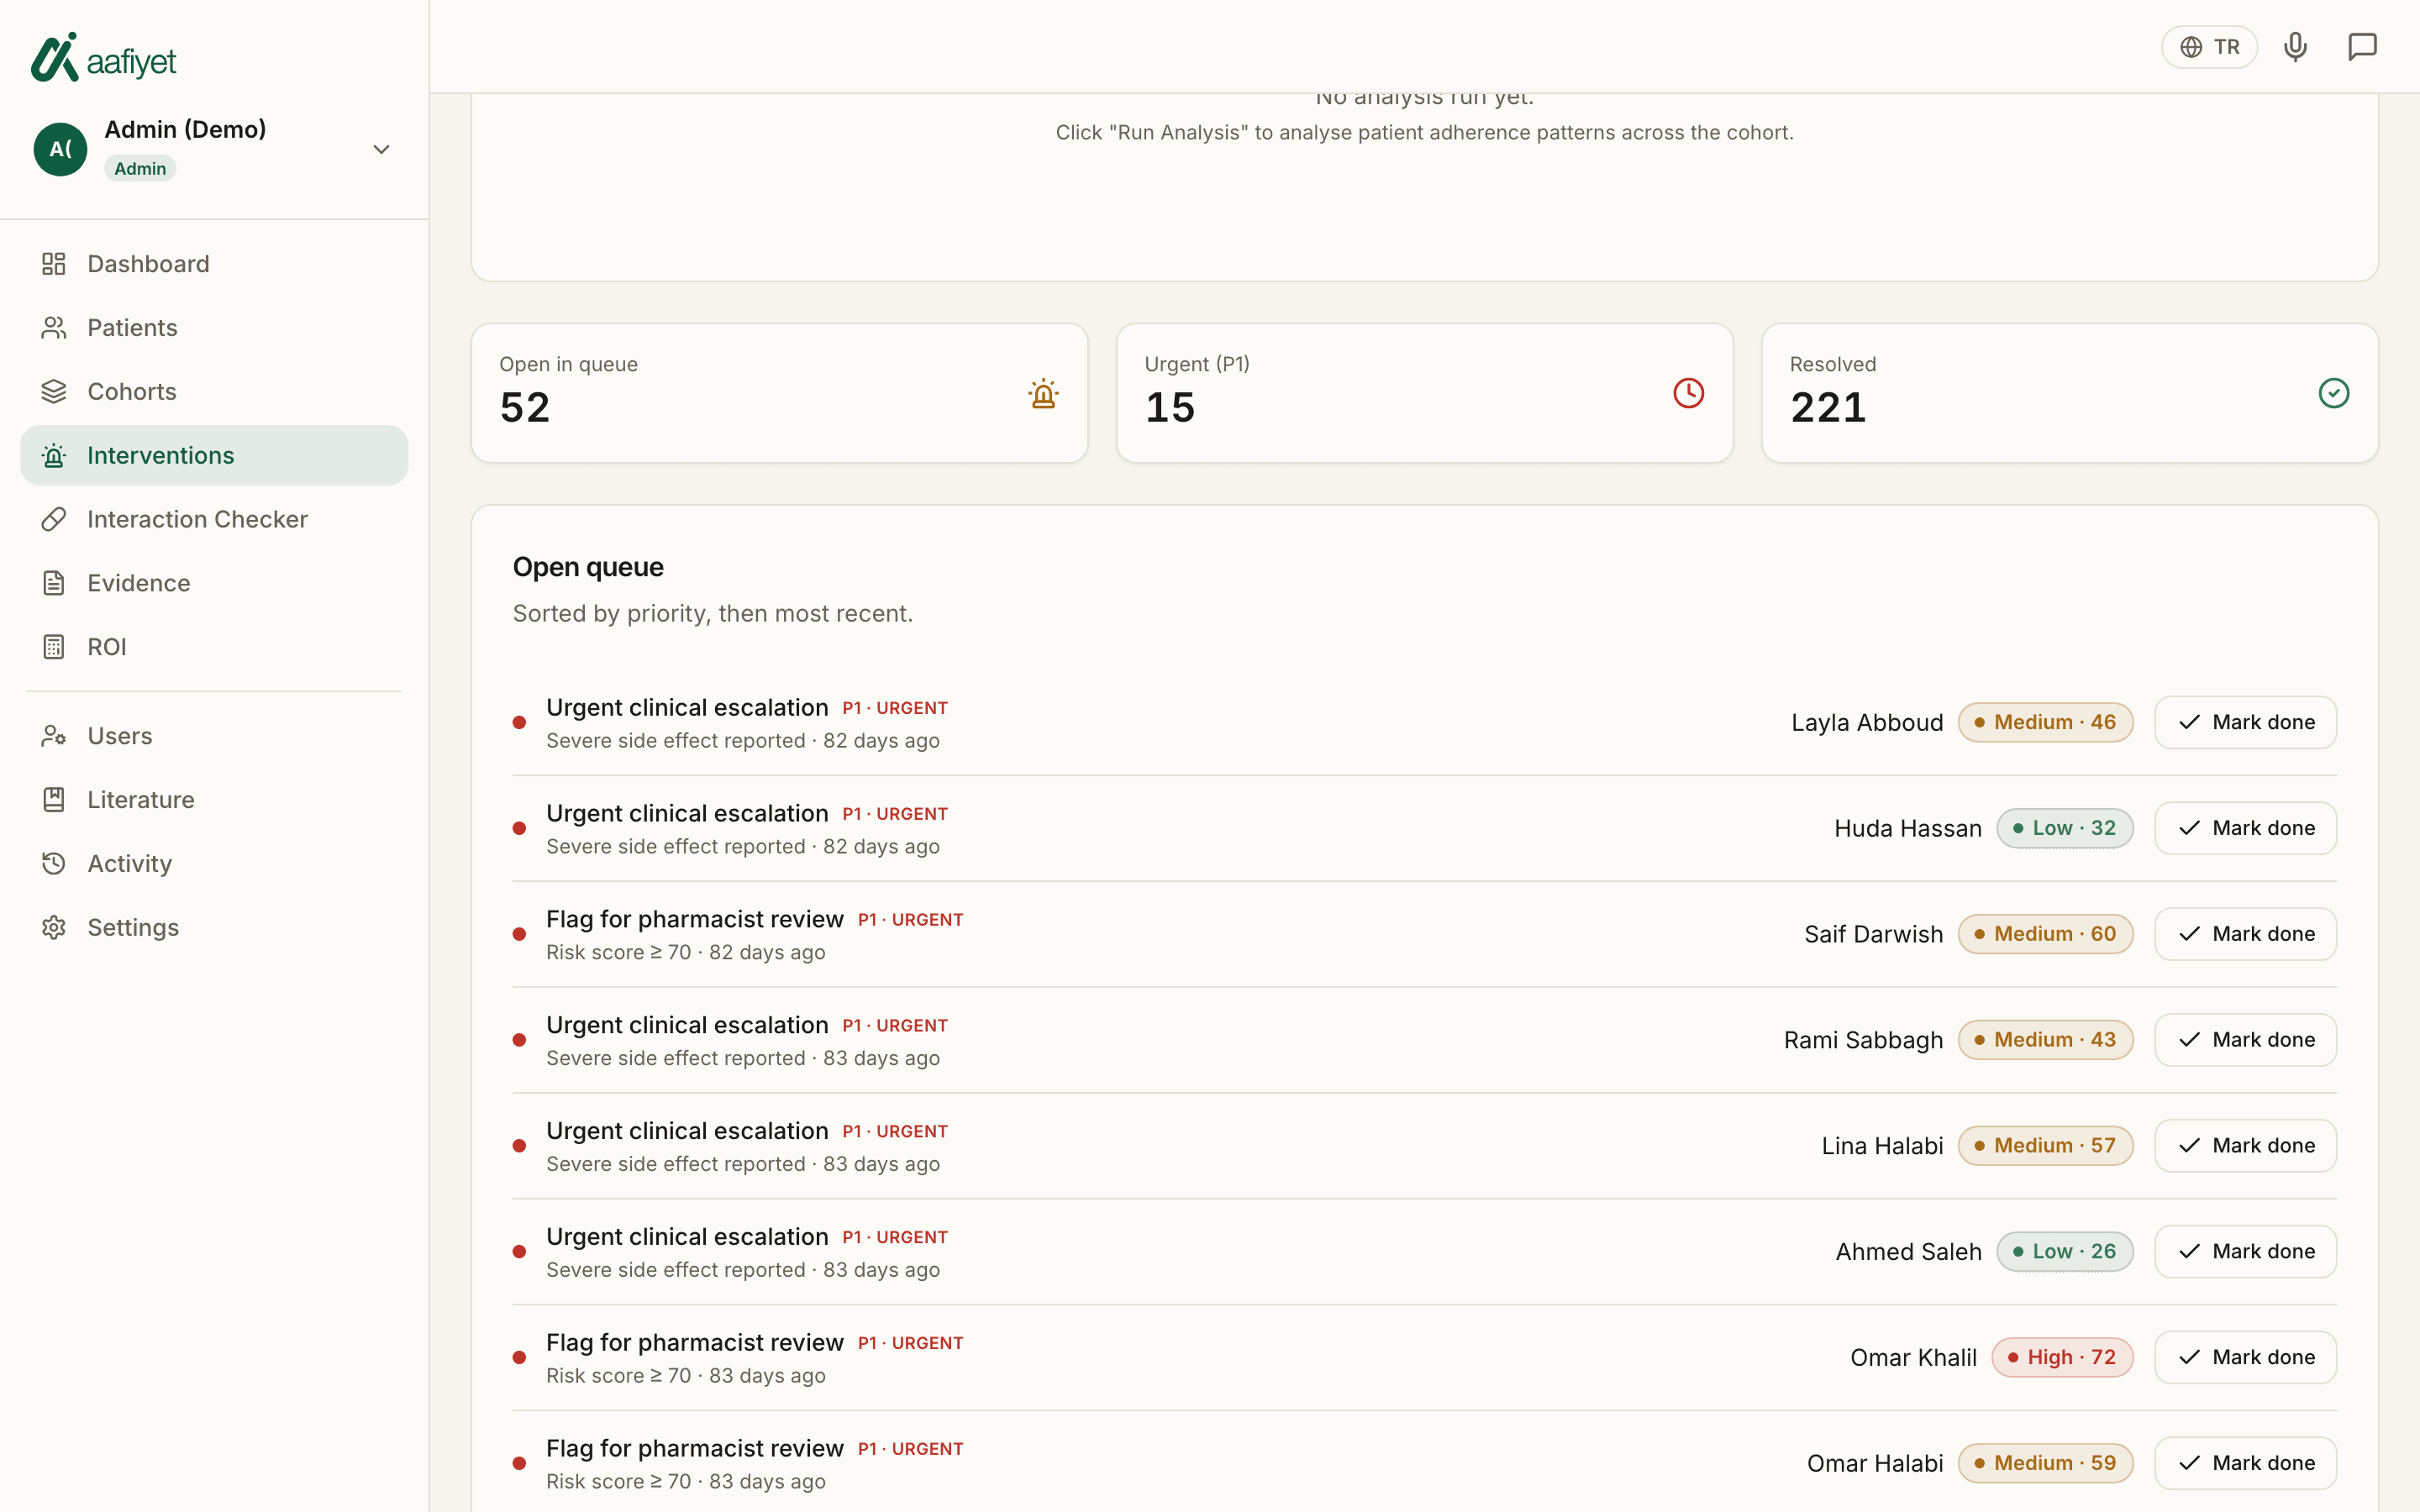
When the model sees something that matters — a run of missed doses, a severe side effect, a collapsing trend — it raises an intervention for a human to review. Nothing is actioned automatically; a pharmacist always decides.
- P1 / P2 / P3 priority with the trigger reason attached
- Resolve inline and keep an auditable record of who did what
- Manual escalation to a caregiver or clinician when needed
Synthetic demonstration data — no real patient information.
Population
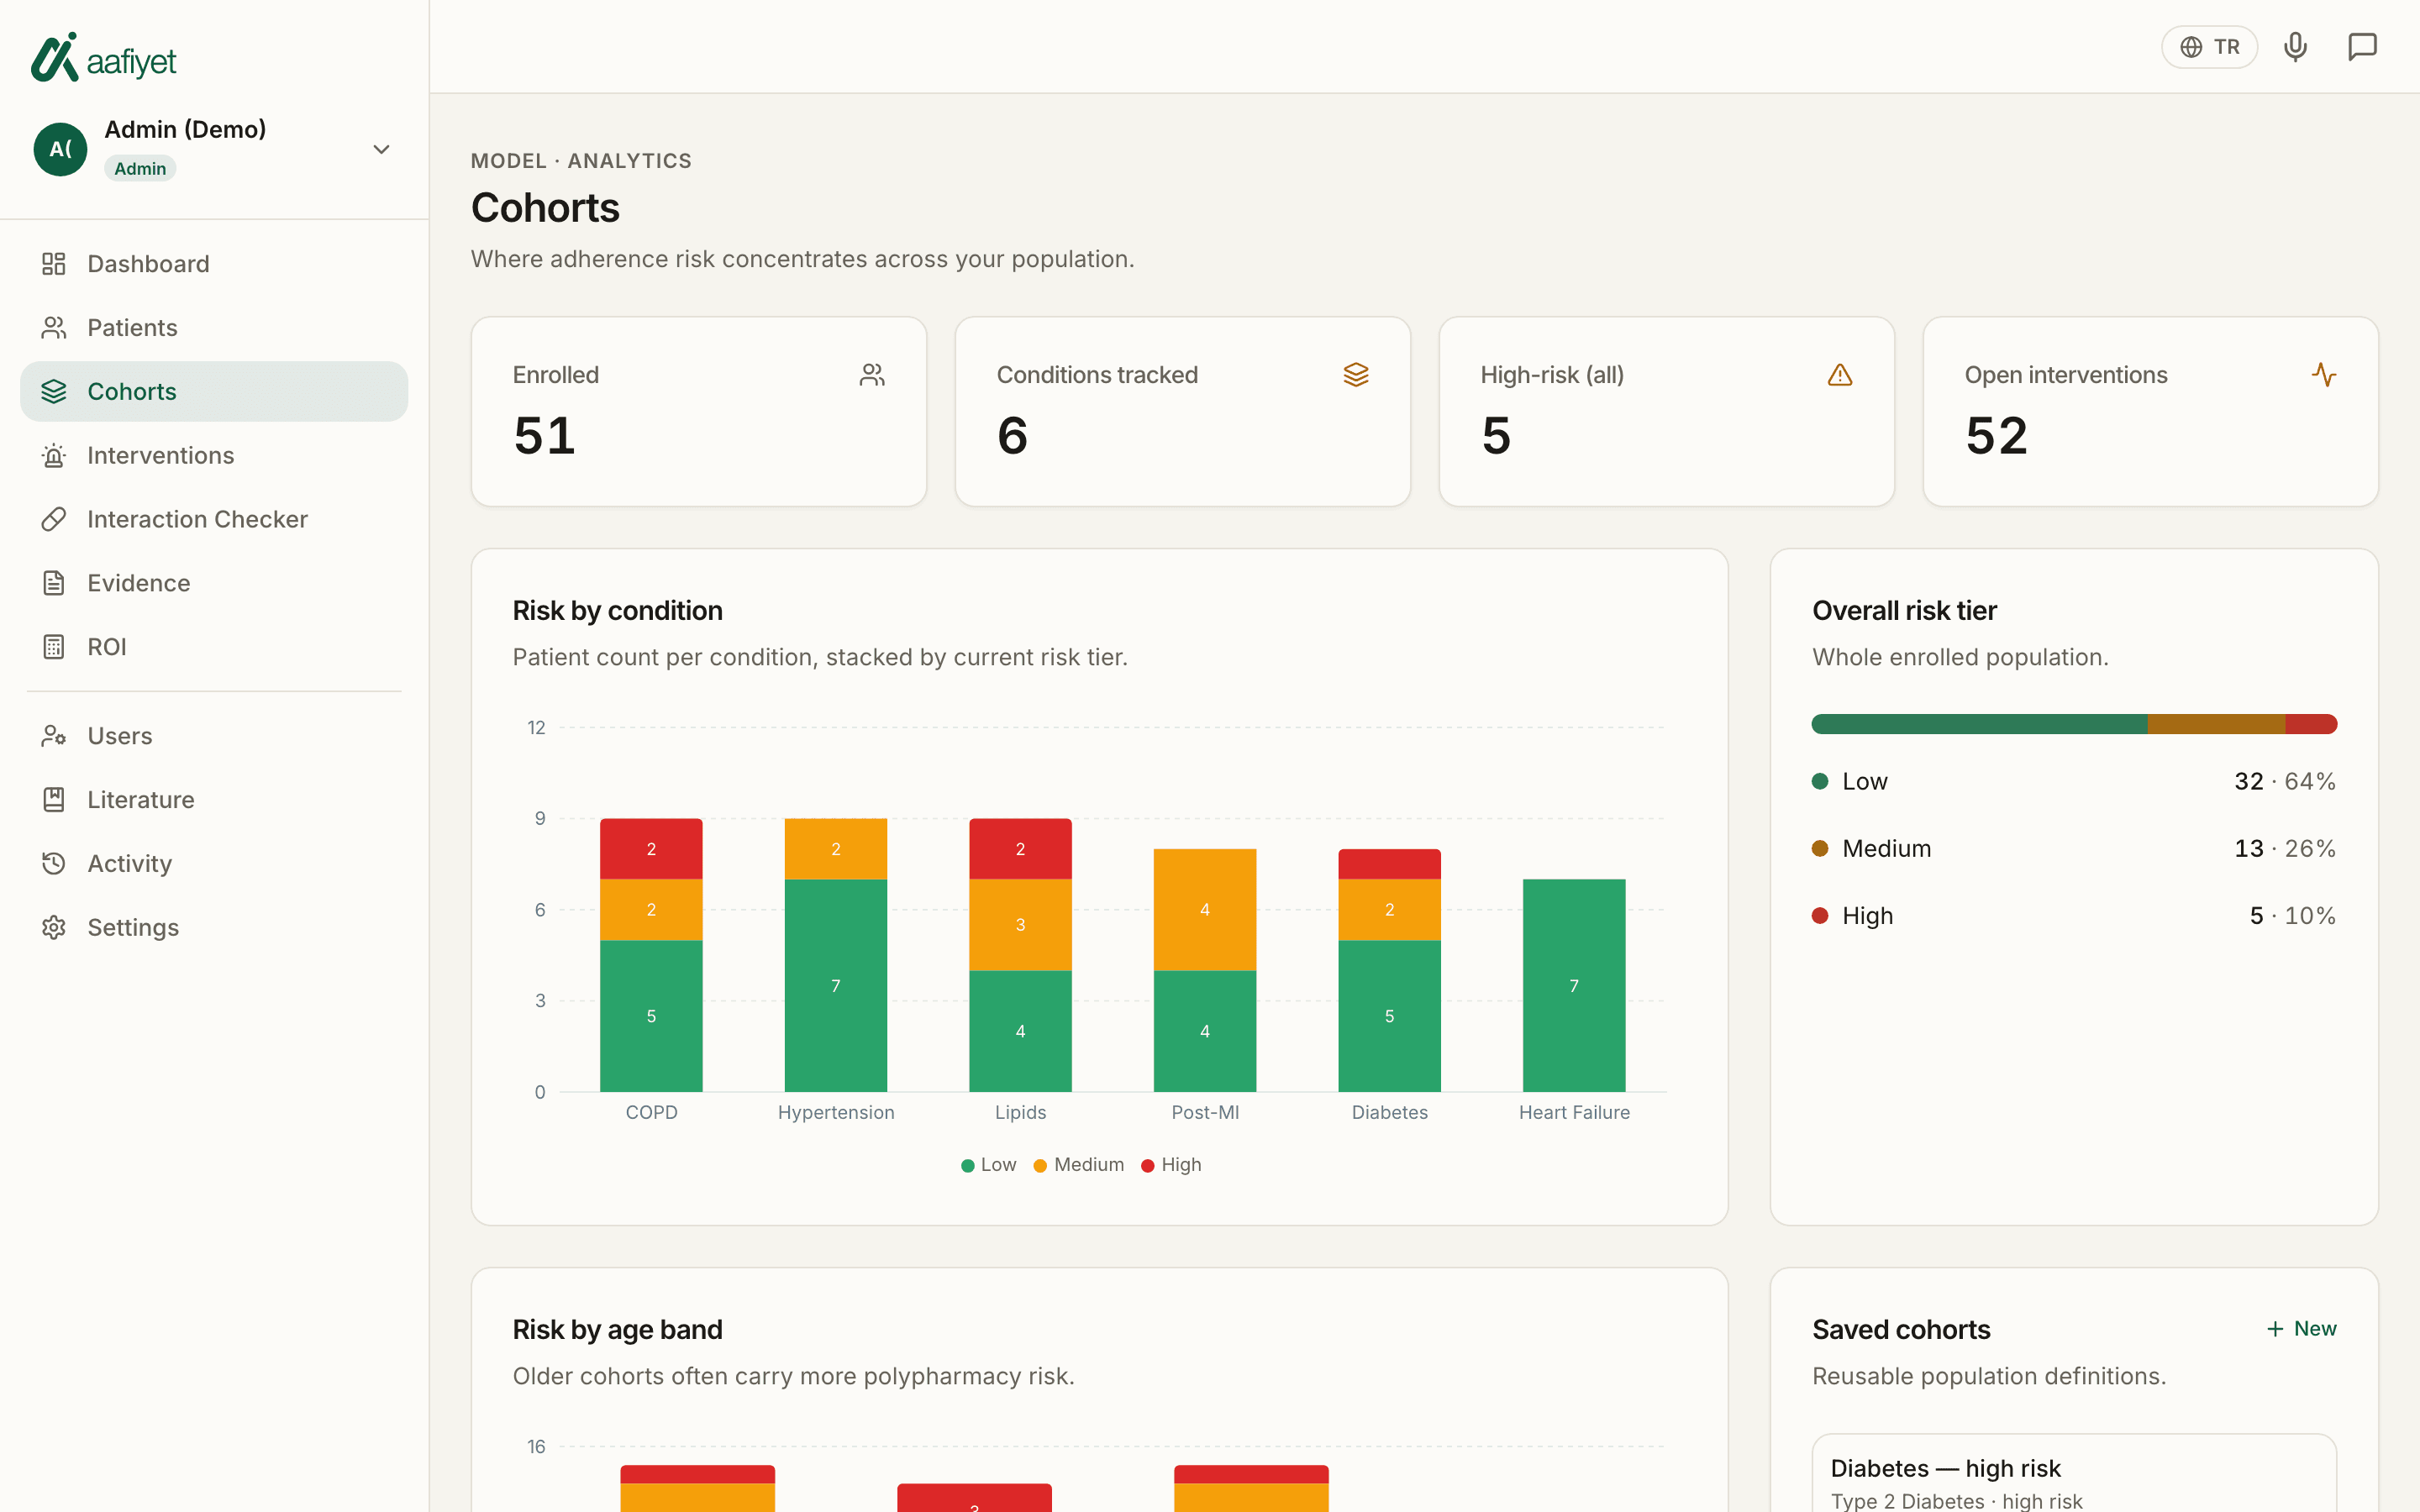
Where risk concentrates across your population
Roll the same data up to cohort level: by condition, by age band, by dosing consistency. Every chart is clickable, so a pattern in the aggregate becomes a filtered patient list in one click.
- Risk tier breakdown by condition and age band
- Saved cohort definitions you can return to
- Timing-consistency view that surfaces erratic dosing
Synthetic demonstration data — no real patient information.
Evidence & ROI
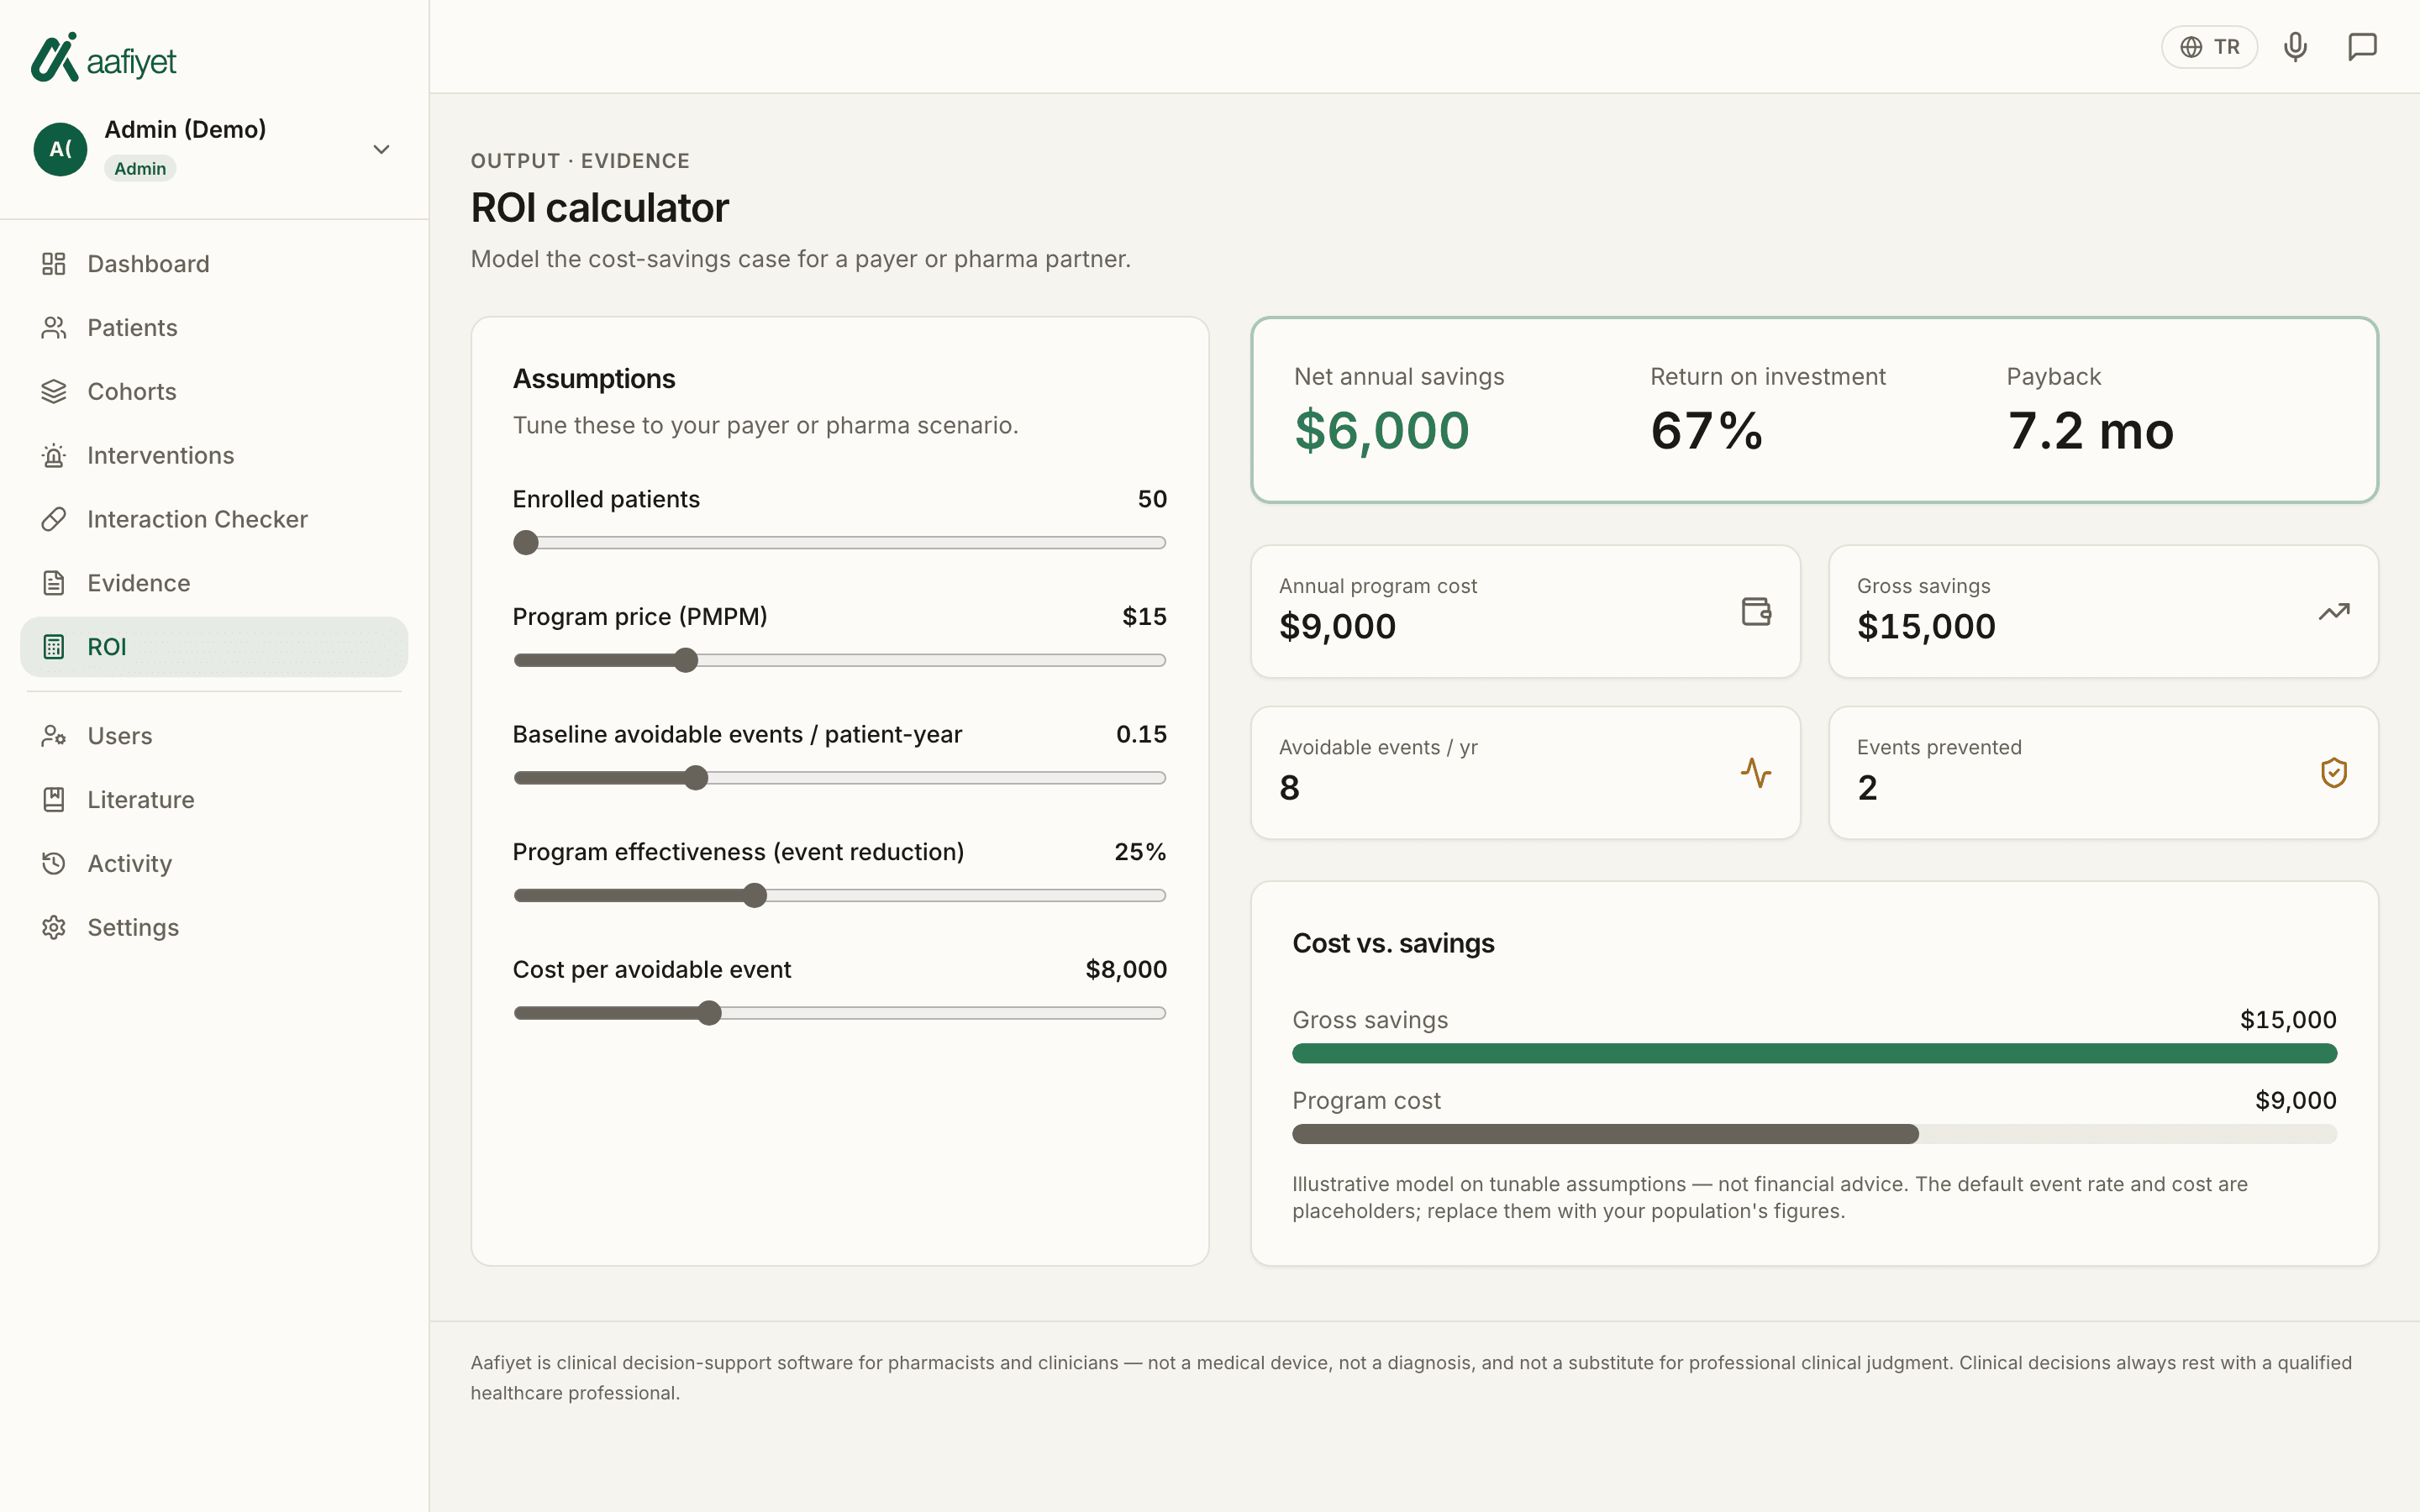
Numbers a payer or pharma partner will accept
The outcome data flows into exportable real-world evidence, and an ROI model you can tune to your own population — enrolled patients, programme price, event rates and cost per avoidable event.
- Adherence lift and readmission rates by condition
- CSV and print-ready reporting for partners and regulators
- Interactive cost-savings model with payback period
Synthetic demonstration data — no real patient information.